Project 1
Objective
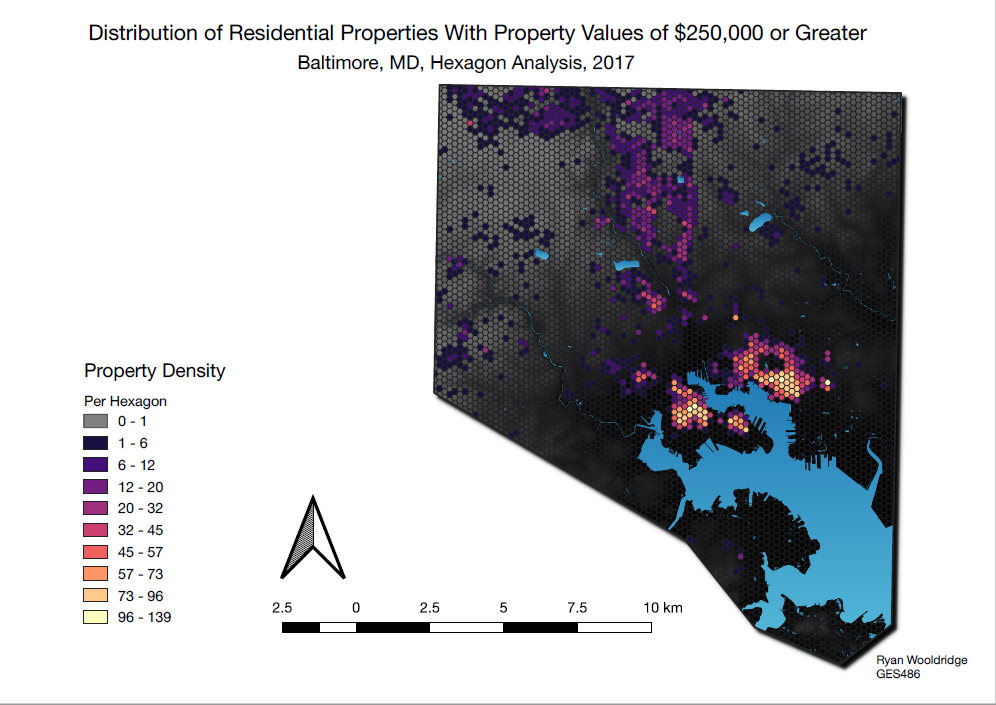
To use SQL to perform a spatial query on a Spatialite database with the goal of examining the density of $250,000 or greater homes in Baltimore City, MD.
Process
- First I imported the Real_Property vector shapefile into QGIS. I also added a shapefile of the water bodies in Baltimore city from:
https://data.baltimorecity.gov/Geographic/Water-Shape/fgsy-8jrm
- Additionally, I added a Baltimore city elevation raster from:
https://www.dropbox.com/s/j7x2ips8donvpd2/BaltimoreCity_DEM_2015_0.7m.7z?dl=0
- Finally I added a Baltimore boundary layer from:
http://gis-baltimore.opendata.arcgis.com/datasets/baltimore-city-polygon
-
All layers were converted to the UTM 18N projected coordinate system (6347) in order to create a 3D map later in the process. Next I created a spatialite database.
-
I then added all of the shapefiles as well as the DEM to the project 1 database.
-
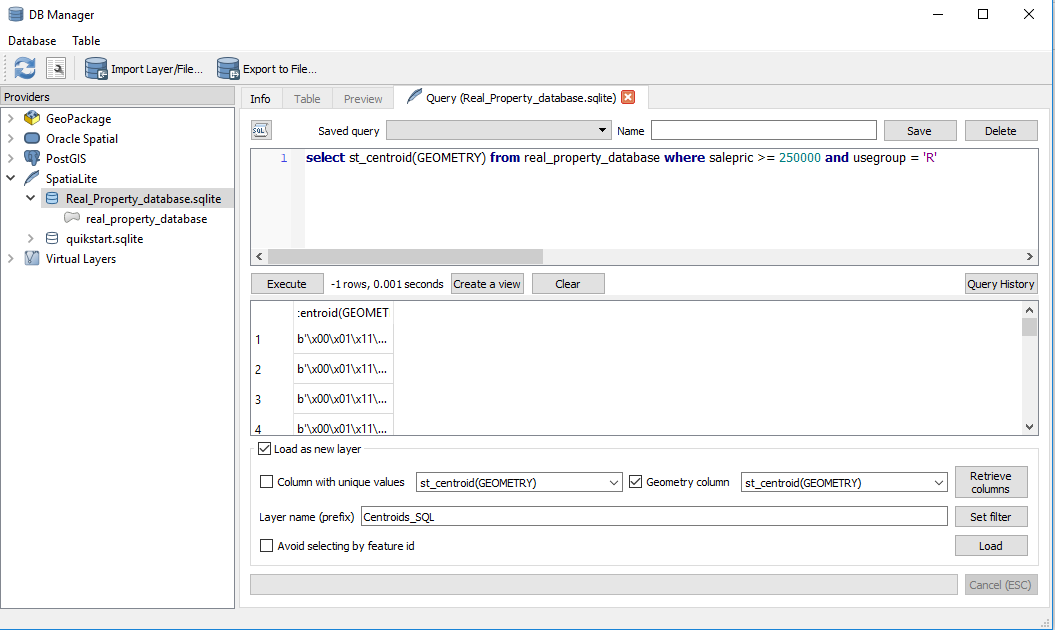
I ran a spatial query using SQL in database manager.
-
The spatial query created centroids of the polygons of residential properties with sale prices over $250,000. The SQL script I used was as follows:
-
In the Attribute table residential properties are indicated under the column “Usegroup” as “R” and sale price is listed under the column “Salepric”.
-
I created a hex grid using the “Create Grid” tool with 0.5km vertical and horizontal spacing to the extent of the boundary shapefile.
-
I then used the “count points in polygons” tool to perform a hexagon analysis. Specifically, I calculated the amount of points representing residential properties with sale prices over $250,000 within each hexagonal polygon.
-
Next I clipped the hexagon analysis layer using the Baltimore boundary layer.
-
I then used the “magma” graduated color ramp to classify and visually display the number of points in each polygon.
-
I displayed the Baltimore city water layer on top of the clipped hexagon analysis layer.
-
I then used the Baltimore city DEM as the bottom-most layer.
-
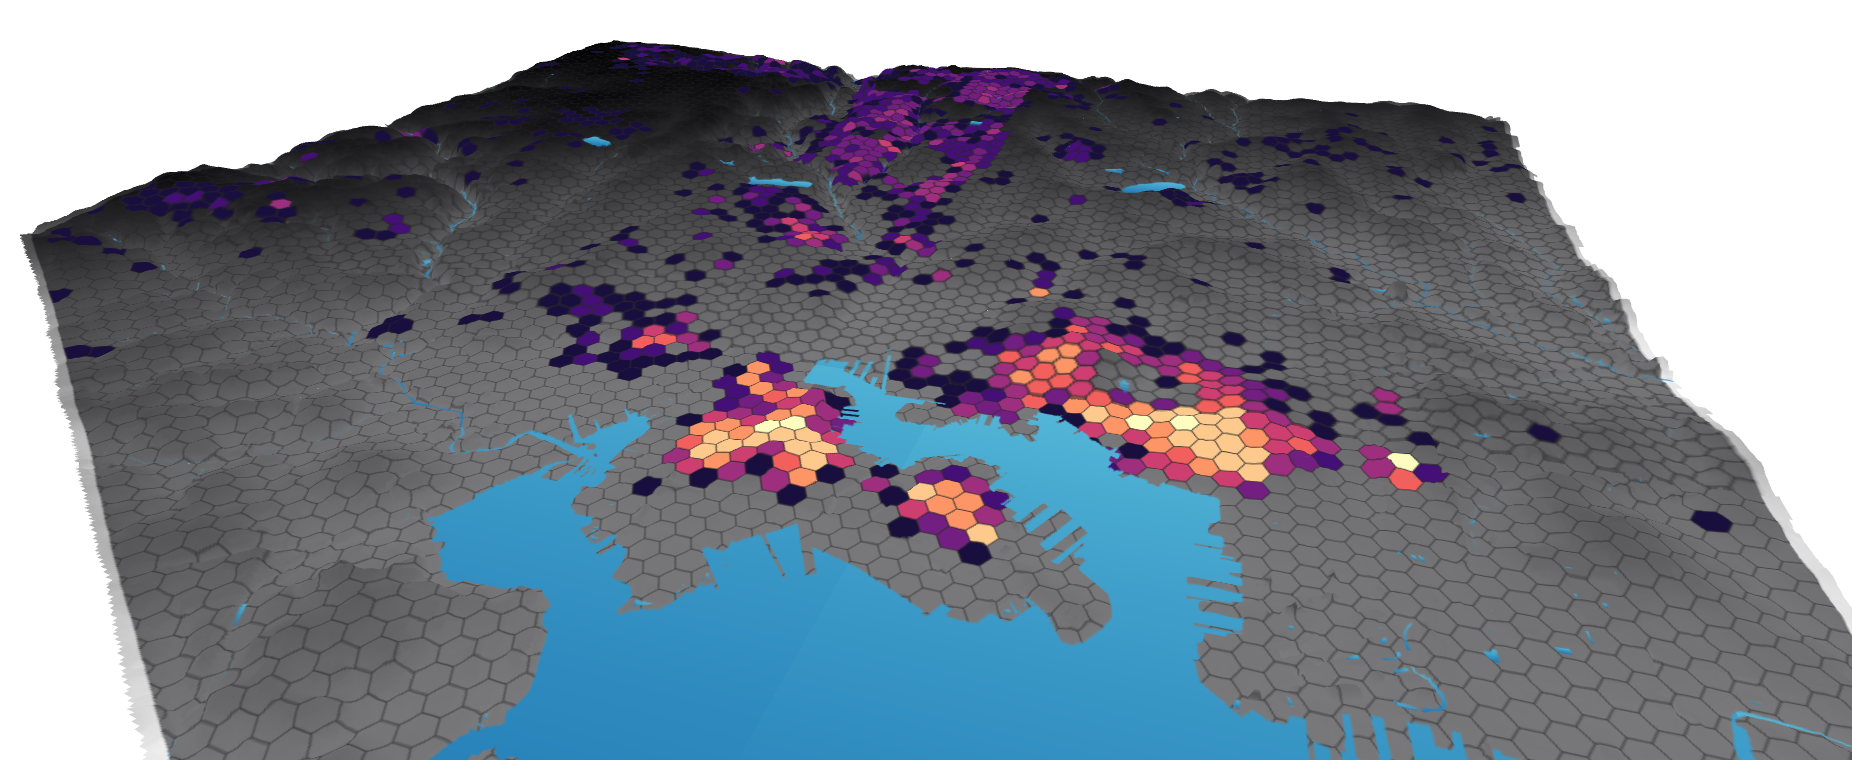
Finally I used the “New 3D View” option under view to create a three-dimensional map of the hexagon analysis overlaid on the elevation map of Baltimore city to view the relationship between factors like elevation and proximity to water to the distribution of residential property over $250,000.
Results
While there does seem to be some relationship between elevation and property value, an important consideration seems to be that proximity to water seems to have as strong correlation to sale price as well. Specifically, most of the high-density clusters in the distribution of residential property over $250,000 seem to be close in proximity to water features.
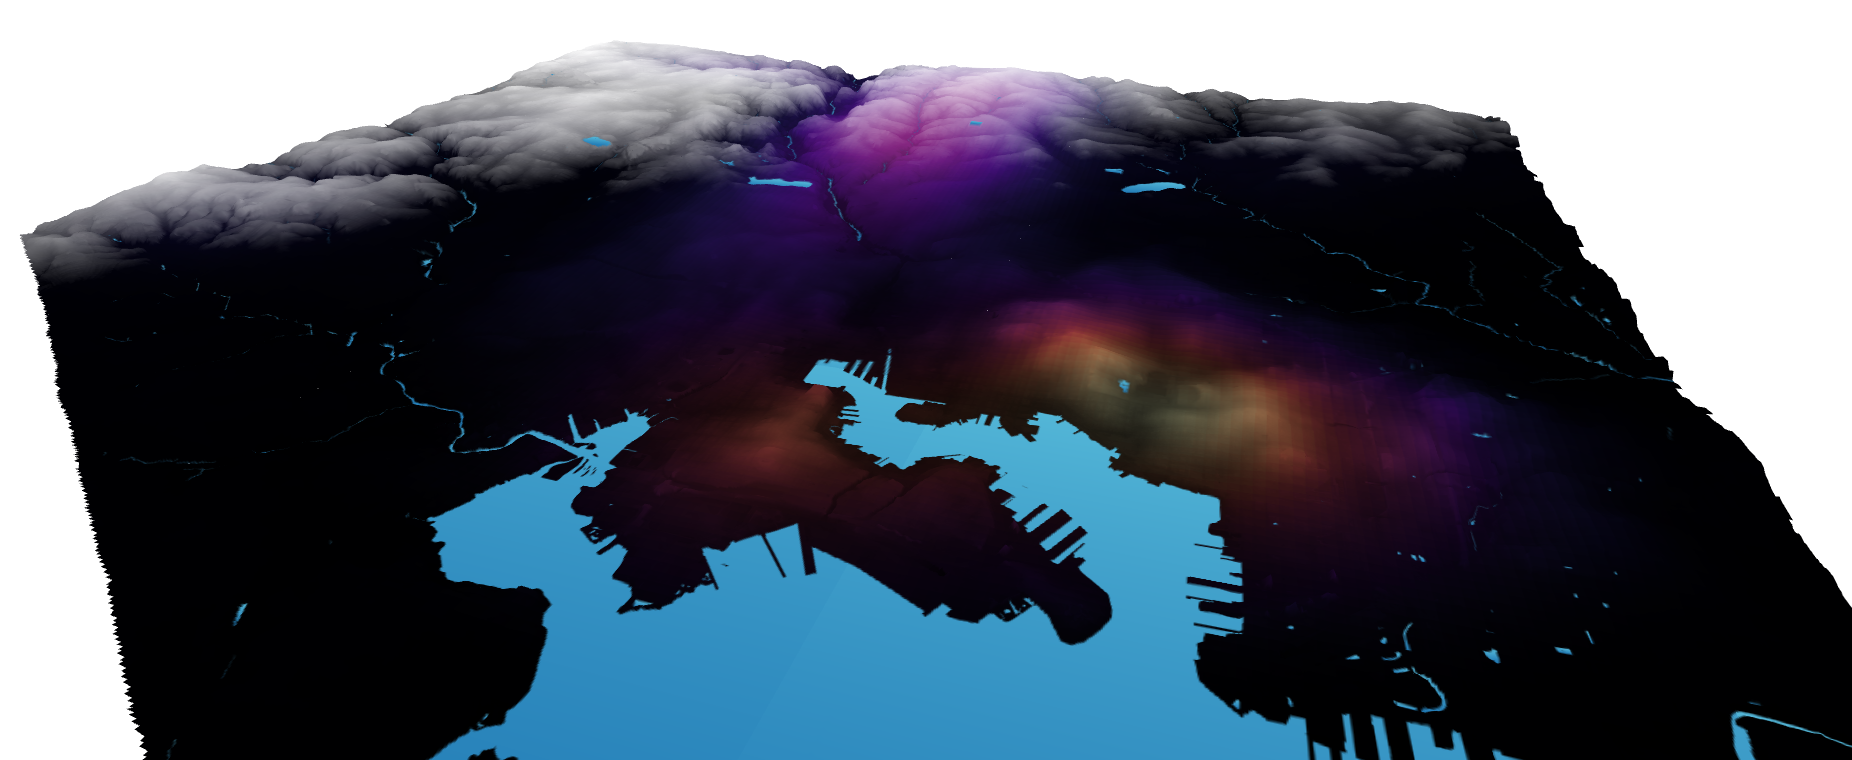
I also created a heatmap of the same distribution of points using the “Heatmap (Kernel Density Estimation)” tool to provide a secondary visualization.
The following is a two-dimensional representation of my findings: