Project 2
Objective
To create a map that shows commercial development in Baltimore, MD over the last century, both spatially and temporally.
Process
-
Using the Real_Property dataset I wrote a python code designed to:
-
Add in the Real_Property Layer
-
Change the fill color to gray
-
Update the layer tree
-
perform a selection commercial lots present during the desired time period in twenty year increments.
-
Save this selection to file as a new Shapefiles
-
Add the new shapefile to the map.
-
-
That code is as follows:
Real_Property = QgsVectorLayer('C:/Users/ges_student/Desktop/Project_2/Shapefiles/Real_Property_Proj.gpkg', 'Real_Property')
Real_Property.isValid()
# Should Return "True"
QgsProject.instance().addMapLayer(Real_Property)
# Should return "<qgis._core.QgsVectorLayer object at 0x000001714E5500D8>"

renderer = Real_Property.renderer()
renderer
#Should return "<qgis._core.QgsSingleSymbolRenderer object at 0x000001F6CBC06DC8>"
symbol = renderer.symbol()
symbol.dump()
#Should return 'FILL SYMBOL (1 layers) color 152,125,183,255'
symbol.setColor(Qt.gray)
Real_Property.triggerRepaint()

layer_tree = iface.layerTreeView()
layer_tree.refreshLayerSymbology(Real_Property.id())

selection = Real_Property.getFeatures(QgsFeatureRequest(). setFilterExpression(u'"YEAR_BUILD" >= 1900 and "YEAR_BUILD" <= 2018 and "USEGROUP" = \'C\''))
Real_Property.selectByIds([s.id() for s in selection])
iface.mapCanvas().zoomToSelected()

QgsVectorFileWriter.writeAsVectorFormat(Real_Property, r'C:/Users/ges_student/Desktop/Project_2/Shapefiles/Comm_Poly_Test2.gpkg', 'utf-8', Real_Property.crs(),'GPKG', True)

Comm_Poly_Test2 = QgsVectorLayer('C:/Users/ges_student/Desktop/Project_2/Shapefiles/Comm_Poly_Test2.gpkg', 'Real_Property')
Comm_Poly_Test2.isValid()
# Should Return "True"
QgsProject.instance().addMapLayer(Comm_Poly_Test2)
- The individual components of the code are shown below:
Add in the Real_Property Layer
Real_Property = QgsVectorLayer('C:/Users/ges_student/Desktop/Project_2/Shapefiles/Real_Property_Proj.gpkg', 'Real_Property')
Real_Property.isValid()
# Should Return "True"
QgsProject.instance().addMapLayer(Real_Property)
# Should return "<qgis._core.QgsVectorLayer object at 0x000001714E5500D8>"
Change the fill color to gray
renderer = Real_Property.renderer()
renderer
#Should return "<qgis._core.QgsSingleSymbolRenderer object at 0x000001F6CBC06DC8>"
symbol = renderer.symbol()
symbol.dump()
#Should return 'FILL SYMBOL (1 layers) color 152,125,183,255'
symbol.setColor(Qt.gray)
Real_Property.triggerRepaint()
Update the layer tree
layer_tree = iface.layerTreeView()
layer_tree.refreshLayerSymbology(Real_Property.id())
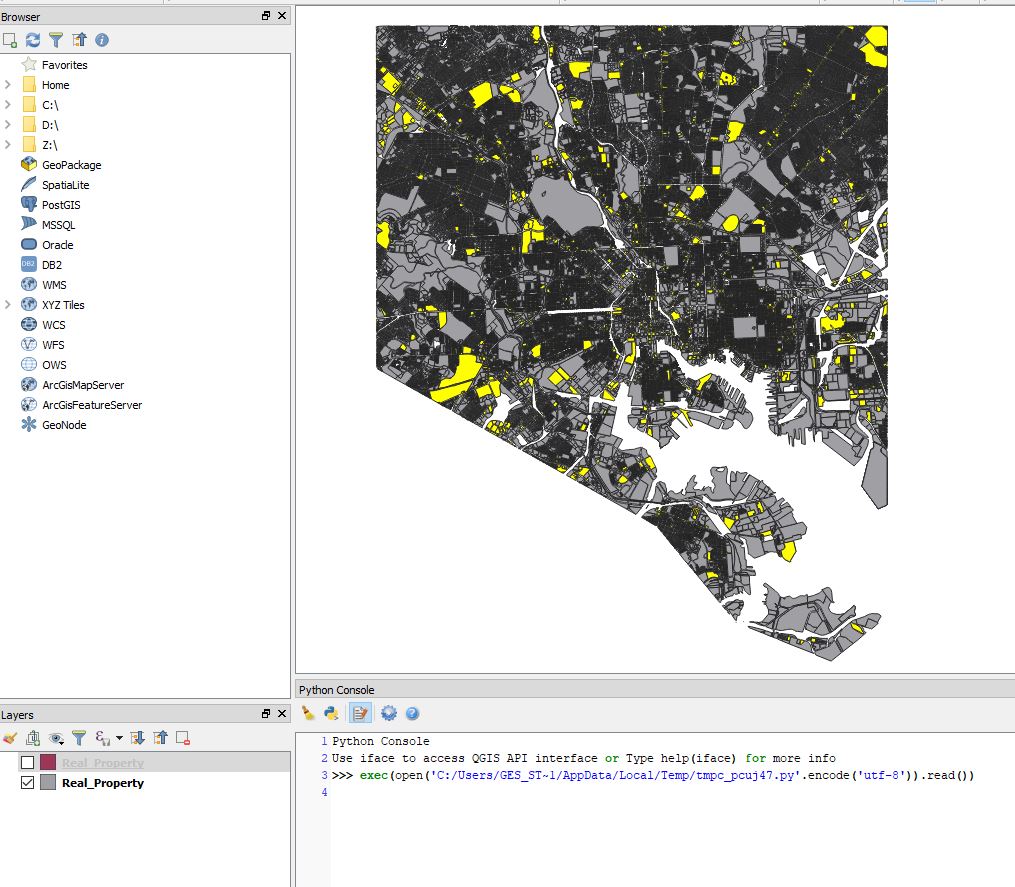
perform a selection commercial lots present during the desired time period in twenty year increments.
selection = Real_Property.getFeatures(QgsFeatureRequest(). setFilterExpression(u'"YEAR_BUILD" >= 1900 and "YEAR_BUILD" <= 2018 and "USEGROUP" = \'C\''))
Real_Property.selectByIds([s.id() for s in selection])
iface.mapCanvas().zoomToSelected()
Script Selection
Save this selection to file as a new Shapefiles
QgsVectorFileWriter.writeAsVectorFormat(Real_Property, r'C:/Users/ges_student/Desktop/Project_2/Shapefiles/Comm_Poly_Test2.gpkg', 'utf-8', Real_Property.crs(),'GPKG', True)
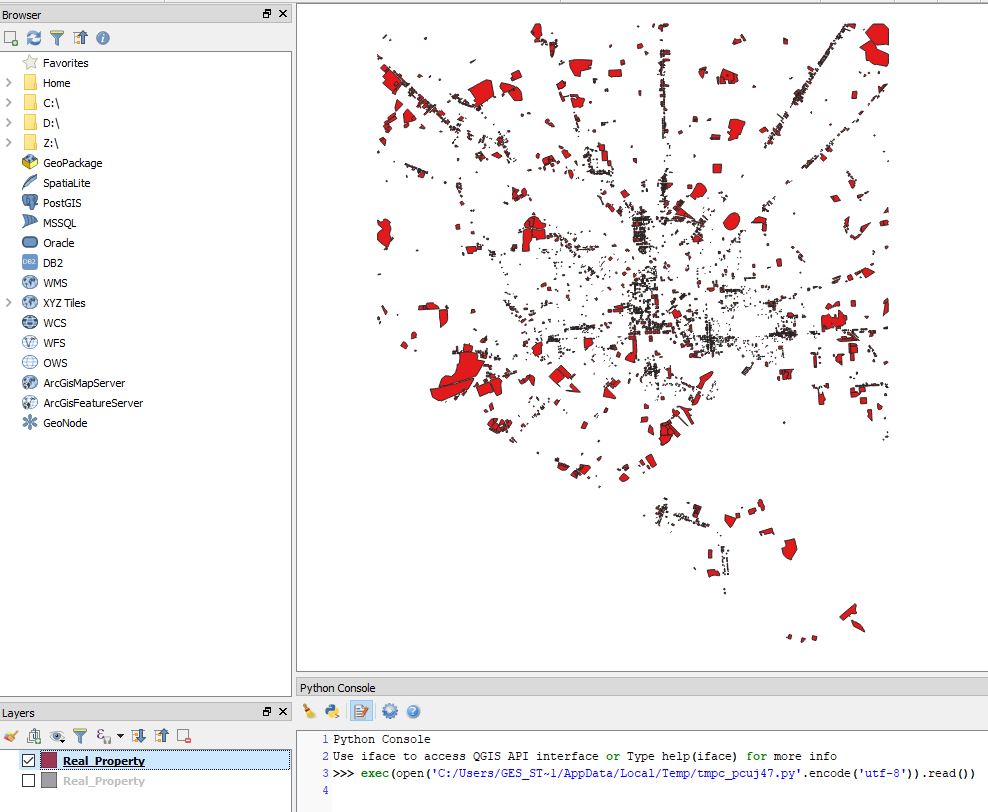
Add the new shapefile to the map.
Comm_Poly_Test2 = QgsVectorLayer('C:/Users/ges_student/Desktop/Project_2/Shapefiles/Comm_Poly_Test2.gpkg', 'Real_Property')
Comm_Poly_Test2.isValid()
# Should Return "True"
QgsProject.instance().addMapLayer(Comm_Poly_Test2)
New Layer Addition
-
From this layer I also created centroids of each polygon.
-
Next I performed a kernel analysis resulting a heatmap of commercial development for each time period.
Results
-
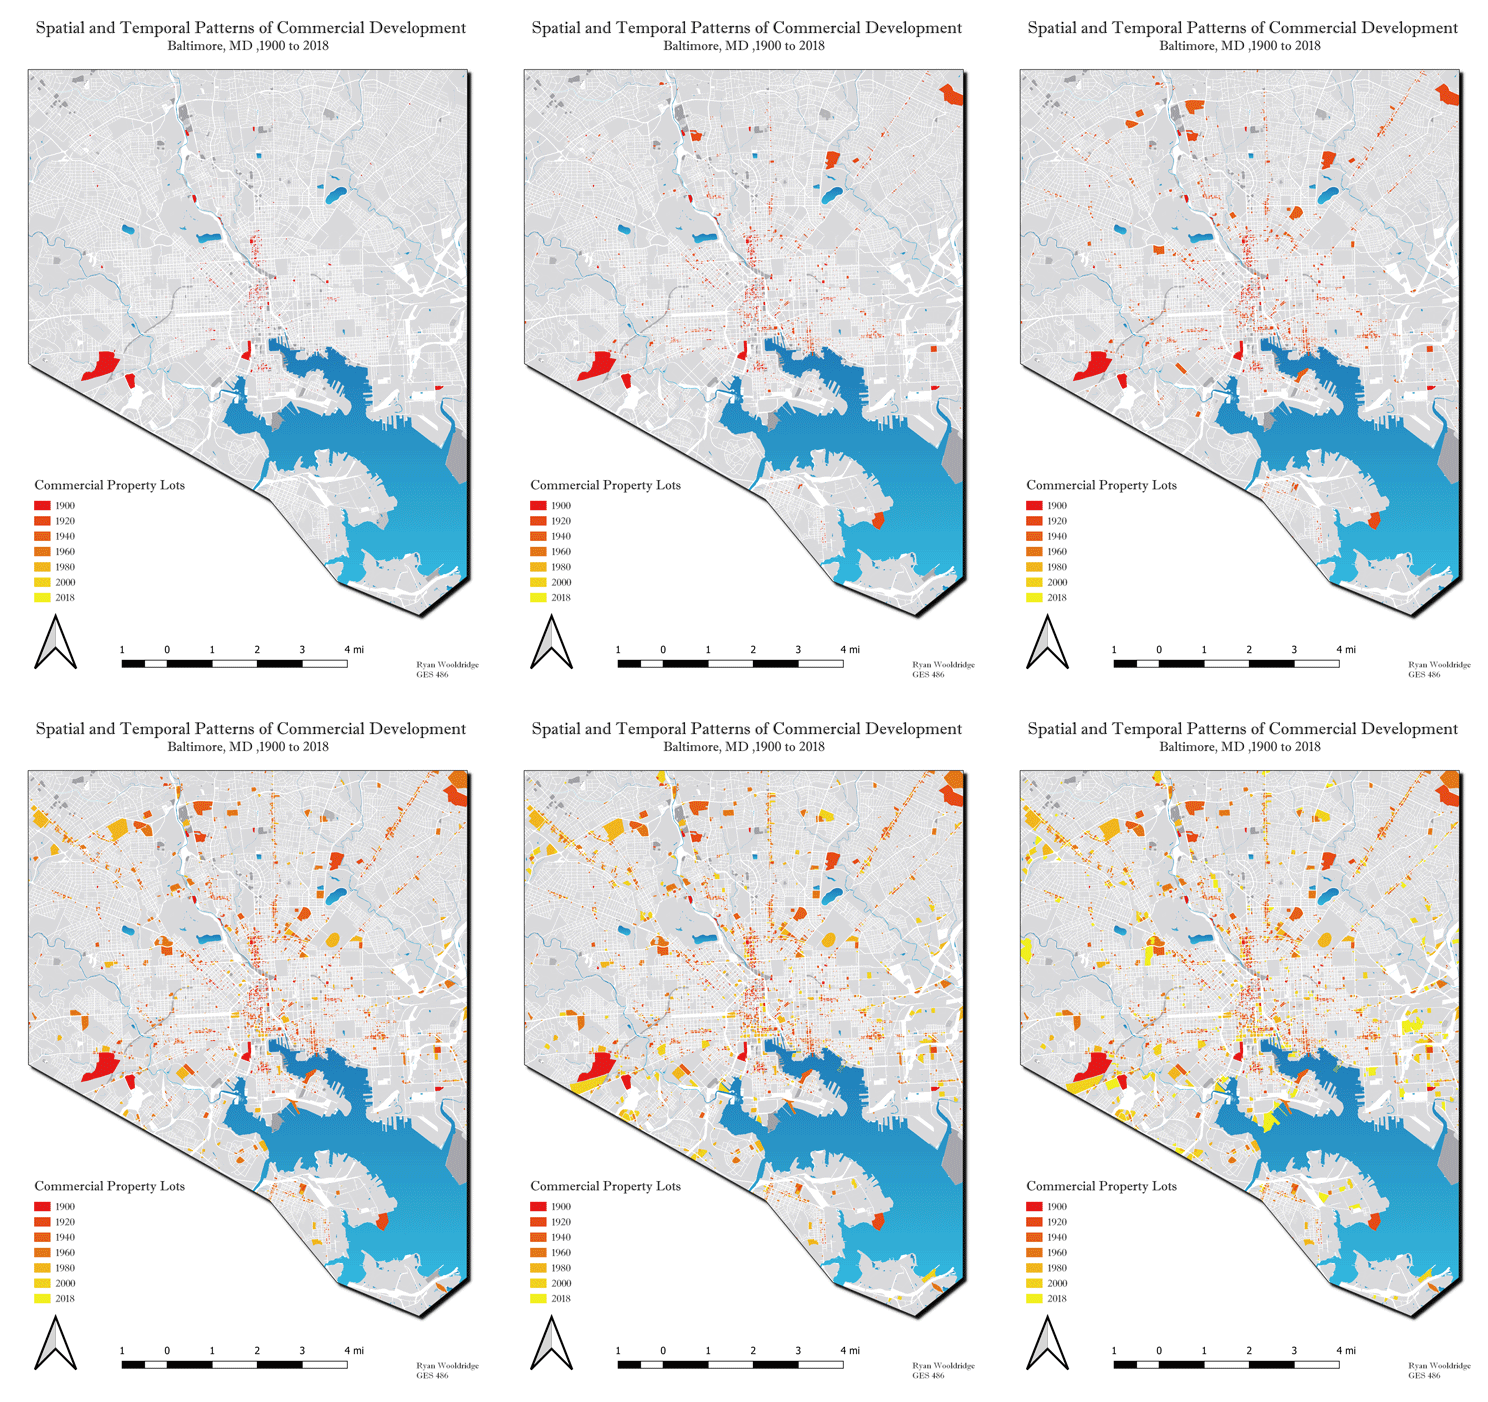
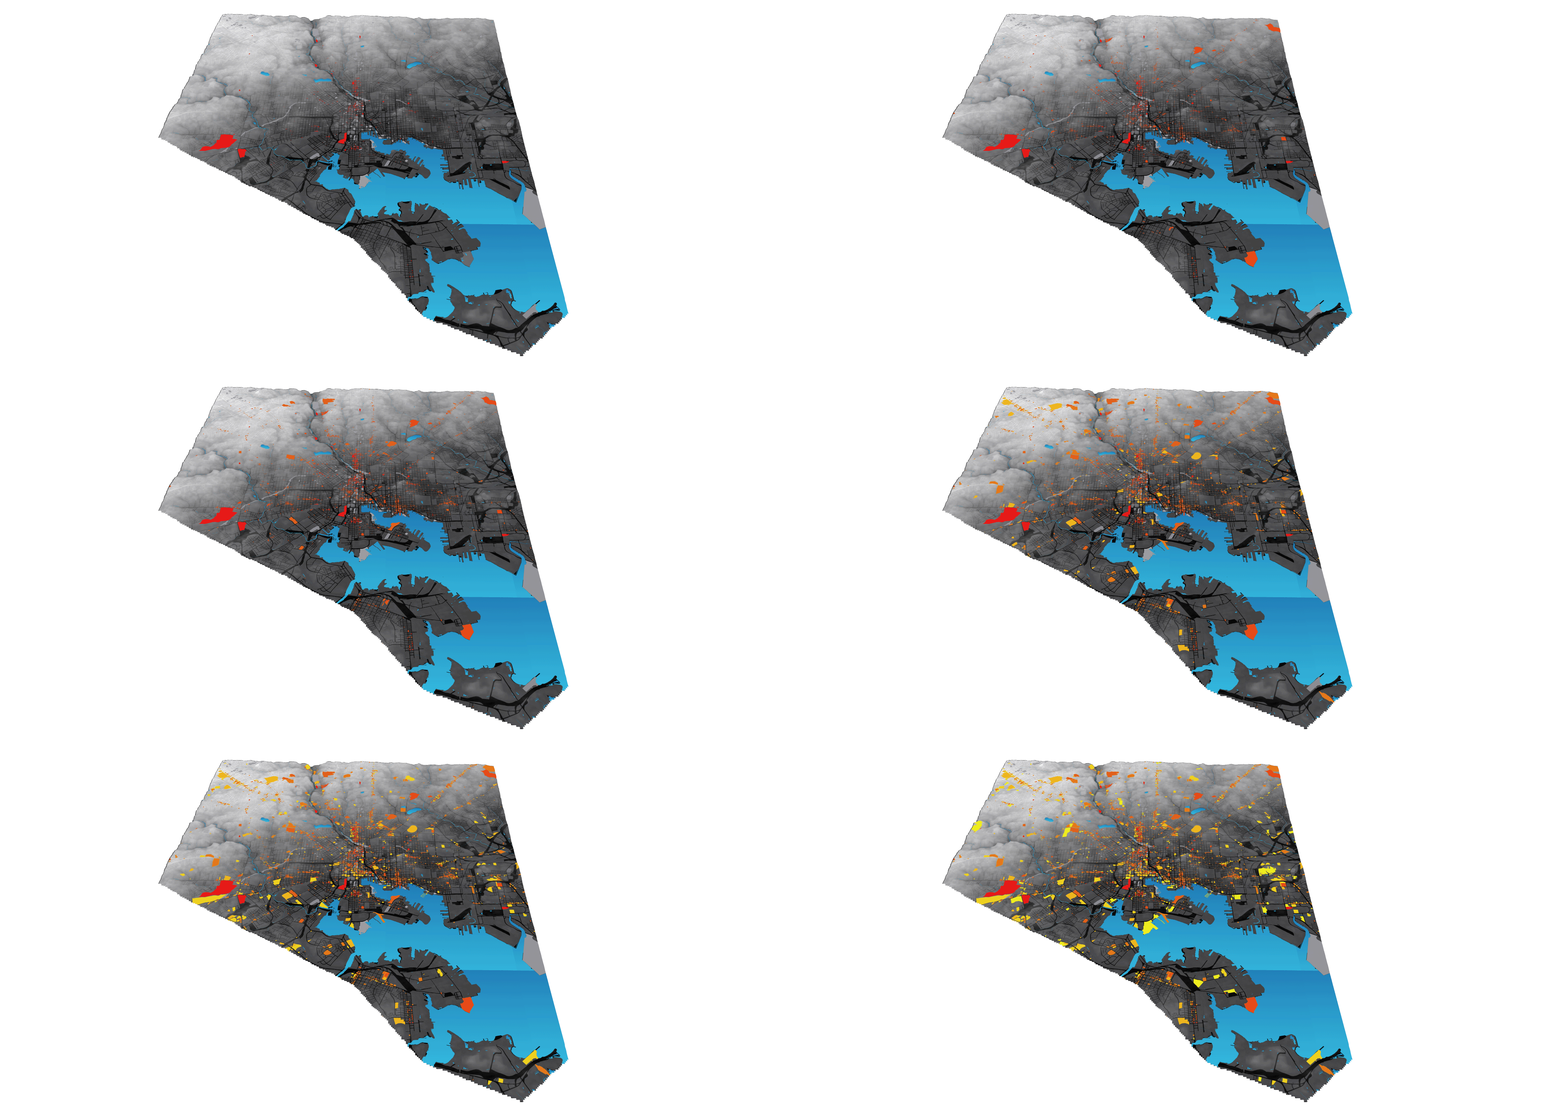
By creating shapefiles for commercial properties in twenty year increments and overlaying them on top of the Real_Property Layer, I was able to make a map that displays not only the spatial pattern of commercial development, but also the temporal pattern by assigning a graduated red to yellow scale in which older commercial properties are red, newer properties in yellow.
-
From this, I was able to use Adobe Photoshop to create a GIF that animates the development process over time and space in Baltimore.
- To create a three-dimensional view of this process, I used these same shapefiles to similarly create an animated GIF of the same commercial development patterns in QGIS 3D map view, using a Baltimore elevation data as the base raster.
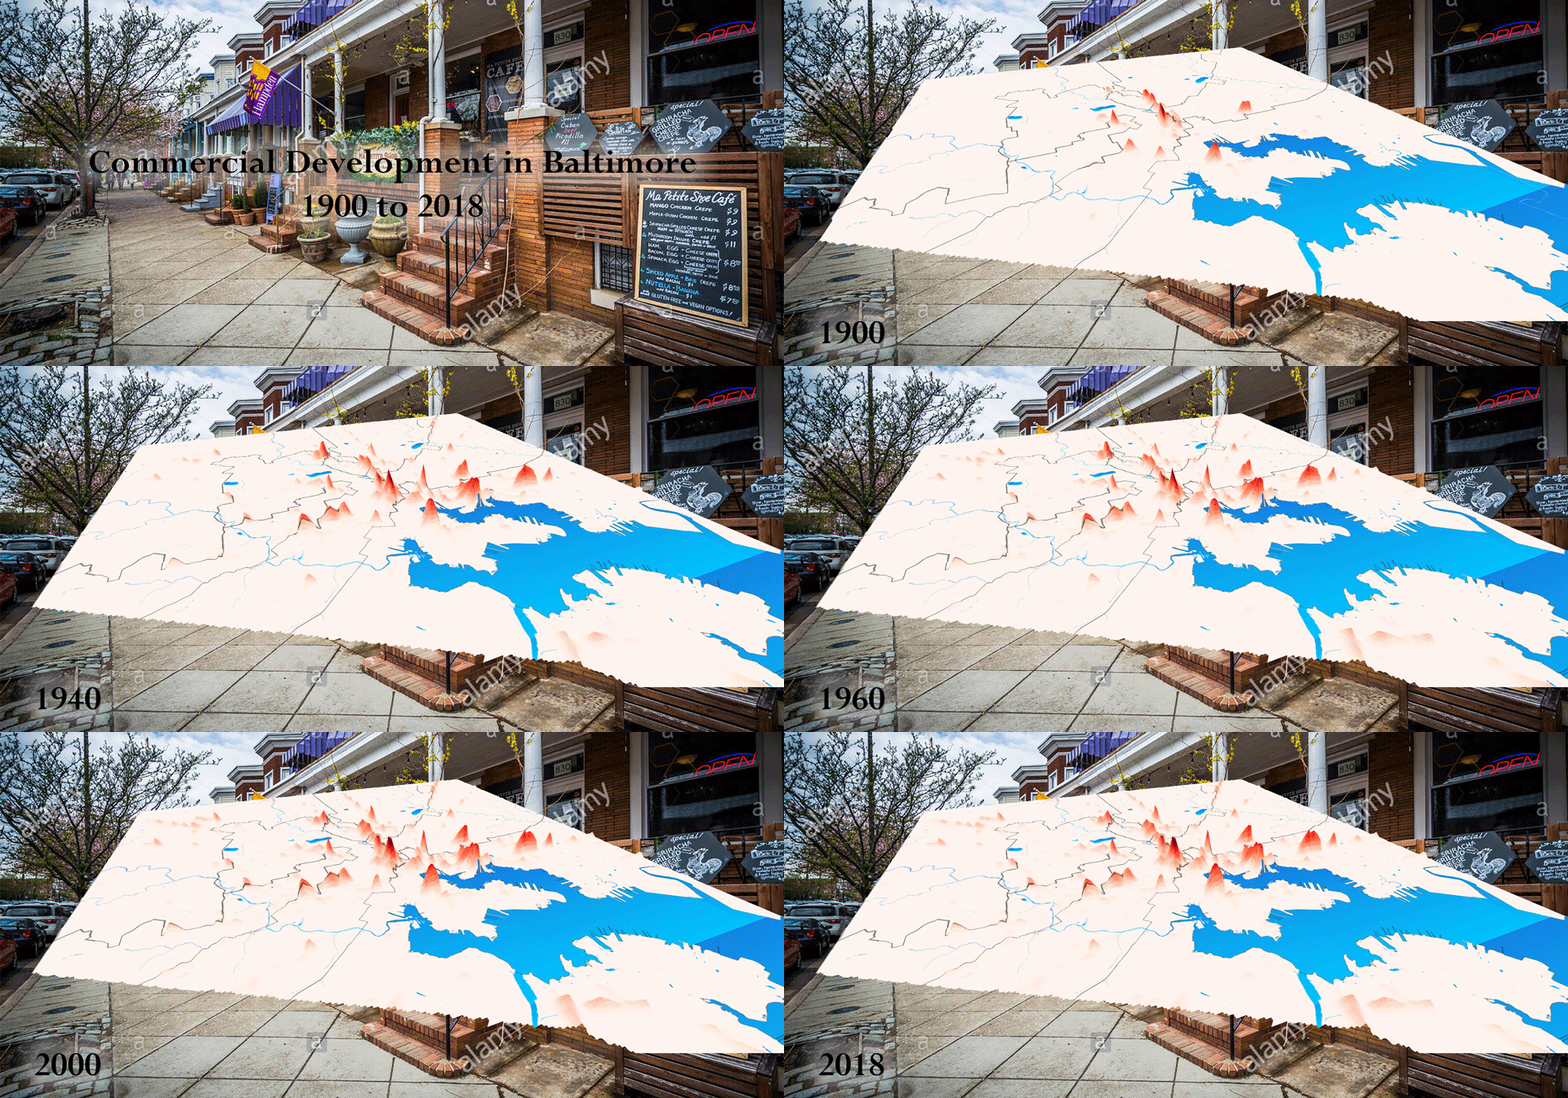
- Lastly, as a unique and different way of visualizing commercial development, both spatially and temporally, I used the heatmaps created by the kernel analysis in QGIS 3D map view and selected them as the elevation raster to be used.
- This essentially results in displaying commercial density as elevation in the three-dimensional view.